Postmortem • Edge & CDN Resilience
Cloudflare Outage — November 18, 2025: What Broke, Why It Cascaded, and How to Lead Through It
What happened
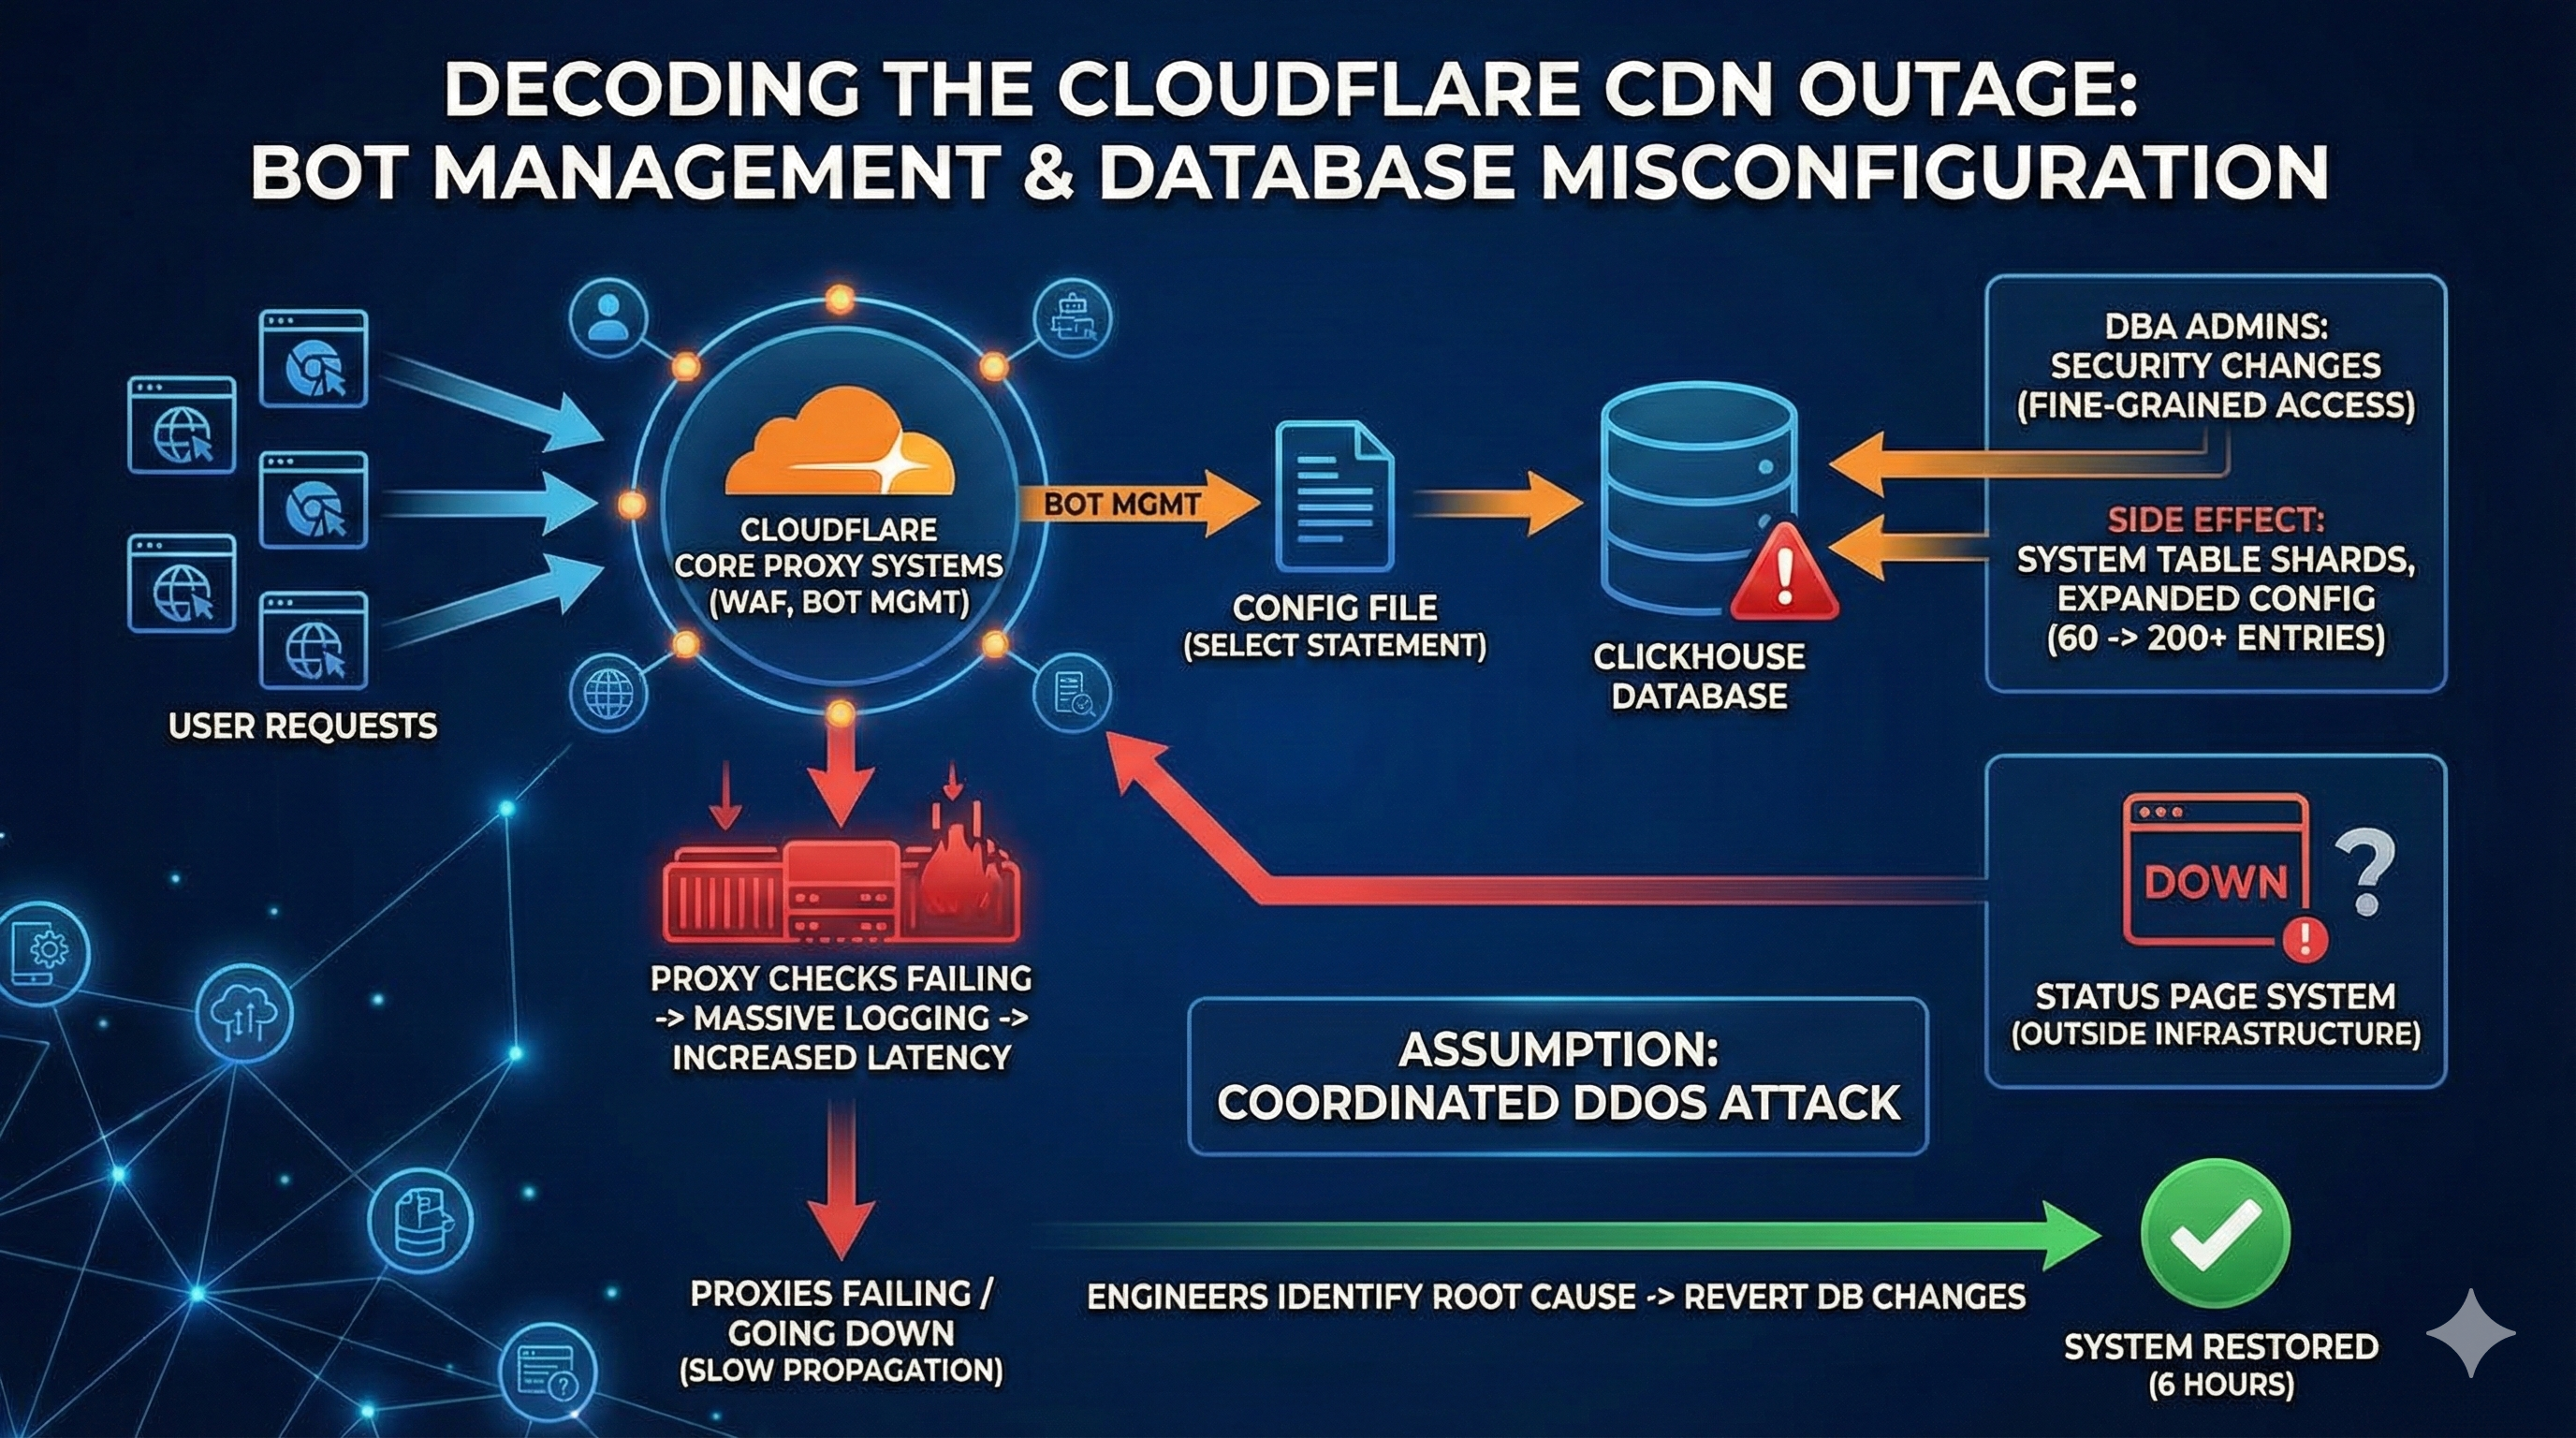
Cloudflare experienced a global disruption impacting websites, APIs, and CDNs across its edge on November 18, 2025. Initial symptoms resembled a coordinated DDoS. The underlying issue was a configuration amplification loop tied to ClickHouse schema changes and Bot Management configuration propagation through the core proxy layer.
Simplified timeline
| Time (UTC) | Event |
|---|---|
| 00:15 | DBA hardening begins: fine-grained access control in ClickHouse (explicit grants by shard). |
| 00:25 | Config build picks up larger-than-expected system-table result (~200+ entries vs ~60 baseline). |
| 00:40 | Core proxies fail BotManagement checks on boot with partial configs; errors logged per request. |
| 01:10 | Logging amplification degrades CDN latency; autoscaling brings in more proxies → they fail too. |
| 01:30 | SEV-1 declared. Working hypothesis: coordinated DDoS. |
| 02:00–04:30 | Proxies disabled in waves; propagation path analyzed; config bloat isolated. |
| 06:15 | DB changes reverted; rebuilt config propagated; recovery verified. |
The technical anatomy
Where it started — ClickHouse × BotManagement
- All traffic hits core proxies (WAF, CDN, BotManagement).
- BotManagement reads a config file generated via a SELECT against ClickHouse system/metadata tables.
- DB hardening (explicit access grants) expanded shard-wise records → the query returned much more data.
- Config files grew ≥3× and took longer to propagate globally.
Propagation meets failure
- Bigger config files → slower propagation.
- Proxies starting with partial config fail the bot/human classification step.
- Each failure emits logs → logging storm (disks/telemetry pipelines overloaded).
- Autoscaling adds more proxies → they also fail → feedback loop.

The investigation spiral
From the vantage point of SRE dashboards, this looked like a DDoS: request spikes, failing health checks, and increasing POP latency. The confusion deepened when the external status page also went down due to an unrelated issue, reinforcing the DDoS hypothesis. Only after taking proxies offline and tracing the propagation path did engineers pinpoint configuration bloat as the trigger.
Key lesson: the system was effectively attacking itself through log amplification and propagation delays. Treat configuration size and replication time as first-class SLOs.
Recovery & mitigation
- Coordinated takedown of proxy clusters to stop log amplification.
- Rebuilt and re-propagated config from corrected schema.
- Reverted ClickHouse access-control changes; validated normal propagation latencies.
- Total mitigation window ≈ 6 hours.

Executive action items
- Configuration as load: add SLOs for config file size, diff %, and replication latency. Fail fast if thresholds are exceeded.
- Cross-team change reviews: database schema/access changes require blast-radius analysis with platform owners.
- Log amplification controls: rate-limit error logs; auto-switch to summary mode under burst conditions.
- Out-of-band status/telemetry: keep status pages and observability separated from production paths.
- Game days: rehearse self-induced DDoS patterns (config storms, log floods, propagation stalls).
Metrics to watch
| Category | Metric | Why it matters |
|---|---|---|
| Config propagation | File size Δ%, replication time | Early signal for propagation stalls |
| Edge stability | Proxy boot-success rate | Detects partial config rollout |
| Logging volume | Errors/sec per POP | Prevents amplification storms |
| Telemetry health | Queue backlog | Signals observability degradation |
| Change management | Schema diff alerts | Flags unexpected system-table growth |